Latest Power Outage Statistics and Causes Tracker
As the world’s technological landscape continues to grow and the demand for electricity increases, so too do the occurrences of power outages. Check out Critter Guard’s curated list where we track power outages statistics and data below or check out our power outages infographic.
Power Outages’ Impact on Homeowners and Businesses Statistics
Collectively, utility customers experienced 1.33 billion outage hours in 2020. (SP Global)
The decade from 2011-2021 experienced 64% more major power outages than that from 2000-2010. (Climate Central)
The average American experienced just over eight hours of power outages in 2020. (EIA)
A 2018 survey found that one in four companies experience a power outage at least once a month. (Bloom Energy)
Animal-Related Power Outage Statistics
Power outages around the globe are caused by a multitude of factors such as severe weather, transmission overload, human error, and animal interference. While a lot of power outages result from severe weather, animal related power outages are common cause of a tremendous number of power outages each year both in the US and nationwide. In fact, animal interference is the second leading cause of power outages in the US. Check out these animal-related power outages statistics below:
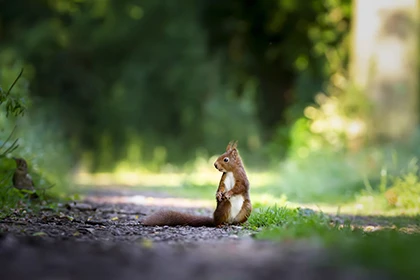
Squirrels and other wildlife are the most common cause of outages at public power utilities. (American Public Power Association, April 2016)
About 13 million Americans lose power to wildlife annually. (The Nature Conservancy)
In 2019, squirrels caused more than 15,000 animal-related power outages. (Entergy)
On average, 48% of outages caused by squirrels and other wildlife occur during the months of May, June, and October. (Unitil)
In March 2022, a bird that flew into an electrical substation was blamed for taking out power for nearly 10,000 customers in New Orleans, LA. (NY Times)
In 2016, a weasel was the cause of a shutdown of Europe’s Large Hadron Collider. (BBC)

